The Disciplined Entrepreneurship Toolbox
Stay ahead by using the 24 steps together with your team, mentors, and investors.

Sign up for our newsletter
What creates revenue?
This should be very simple as in the example I have provided. It should be some “units” time average selling price (ASP). ASP is the average amount of revenue that you receive per unit. This is after discounts and commissions you pay to resellers. It is the actual money that flows into your bank account.
What do you mean by “Units”?
This can be a bit trickier than it might first appear. Units can be the number of products sold.
However, it could and more properly (for future calculations) should be one average customer. If an average customer buys only one product, then these two are the same. On the other hand, if an average customer buys 2 products, then they are not the same. The model would get a bit more complicated like below:
You are probably thinking, why does it matter? It does. As we get later and we are analyzing our marketing and sales costs, we are going to do it on a per customer basis as opposed to a per unit basis so we need both the number of new customers (for the future) and the number of new units (for now).
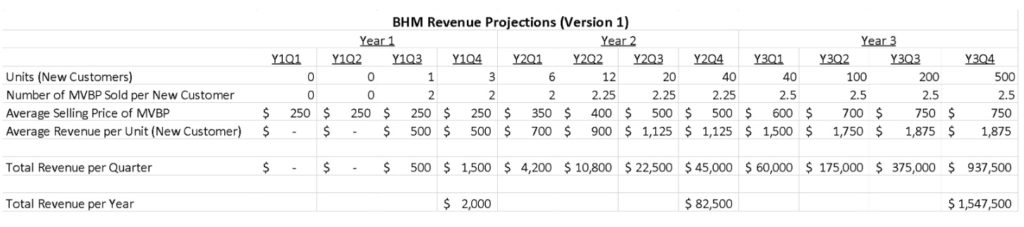
What is the average revenue per unit?
In the case above, the average revenue per unit is based on the customer. Let’s look at one quarterly example for the first quarter of the second year. The ASP for the product this quarter is $350 but since the unit is an average new customer, the average revenue per new unit is $700. This is because, in this quarter, we are projecting that, on average, a new customer will buy two of our products.
This may seem a bit more complicated but it is important to set us up to understand the unit economics involved with LTV (Life Time Value of an average customer) and the COCA (Cost of Customer Acquisition or also often called CAC, Customer Acquisition Cost). These are important lenses through which to analyze our business and we want to make sure our model is aligned with them.
It is helpful to see the size of the total BHM in units/customers so you can quickly understand market penetration
Another piece of information that you should have available and I actually like to include in the modeling is the size in units of the target market you are addressing. This should not be your basis for calculating your revenue projections (that should be “bottoms up” with specific customers) but rather a “sanity check” that they are reasonable.
In this case, it is the BHM and not the overall market (we will add the overall market later once we have this done).
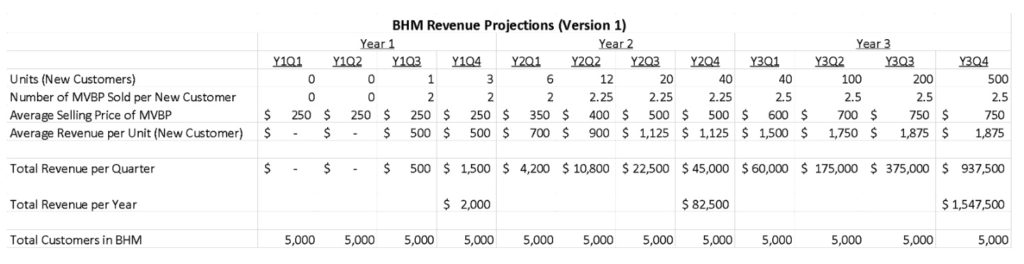
As you can see now in the last row, there are an estimated 5,000 customers in their BHM so getting 500 in a year is put in a much more concrete perspective. Is 10% reasonable in one quarter or not? It depends on the nature of the market. This number also tells you that by the end of year three you expect to have over 900 customers within this market which is almost 20% of the market. Is that reasonable or not? It depends on the marketplace dynamics and the strength of your product but this number gives important context.
It also gives an indication of when you will reach saturation in a market, in this case, your BHM.
There can be a case made to not crowd the spreadsheet with this number but rather note elsewhere, e.g, footnote, comment, backup, or verbal comments. There certainly is a benefit to keeping things simple but whether it is on the spreadsheet visible in your model or not, you need to know this number and explain it at some point.
Level of Precision
As mentioned before, critics of models will say “they are never correct!.” That is true from a precision standpoint but it does not mean they are not useful. They can certainly be both not precisely correct and very valuable. However, there is a very valid point that you should not get caught up in a level of precision that you cannot know and such specificity is not useful, like the exact numbers of new customers in the third quarter of the third year. You should come up with a reasonable number and be able to justify it. The closer in time you are to your numbers, the more precision you should have. For instance, if you are projecting the number of new customers in the next 30 days, that number should be quite precise and you should be able to back it up with great specificity. It is still a forecast as it is in the future so it is not a certainty but you should have confidence and resolution that you will not have for a forecast on the number of new customers in year five. In year five, it is not only a good way away in time but you will also be layering on additional markets beyond the BHM for which you have not done extensive PMR (Primary Market Research).
In the near term, you should have much higher confidence and rely on specific bottom-up information you have collected directly via PMR and selling efforts already underway. In the long term, you will depend more on secondary research. As such, as you get into the out years, make sure you don’t indicate precision on the numbers that you obviously cannot have. You will lose credibility and waste time.
Even in the short term, don’t waste too much time on the precise numbers but rather get to the general numbers and ranges … and what drives those numbers. Remember, your goal is to have a valuable model less than having a precise model. The former is much more attainable in a reasonable period of time and the latter could be a sinkhole of your time for something that will never be possible. All of this being said, build a good defensible model that explains your business and don’t use the “it will never be right” excuse to not build a useful model.
How do items in our model vary over time?
So far, we have only discussed how a few things would vary over time, like the ASP for the product. If things are not going to change much, you can just leave them constant but if they are going to change materially, you should look at incorporating positive or negative growth rates. The ASP showed a positive growth rate in the simple example model we have been discussing as we gain pricing power from our customer successes. We also see the number of units purchased by customers increasing, as they get more confident in our solution.
What could experience a negative growth rate? The number of customers in our target market might decrease due to consolidation or other market factors. We might see a decrease in ASP as competitors flood the market after they see our success or our patent expires. I would encourage you to not get caught up in these things at first as you build your model but leave the ability to add them in later as you refine your model.
What is the lifetime of a customer and/or product?
As you build your model, other questions will continually arise but one that will arise very quickly is, “what is the lifetime of a customer and/or product in your situation?” How long you will retain a customer will affect the follow-on revenue that you will get from that customer. This includes whether they will be a replacement product if the current product becomes obsolete from use or advancement of technology. Think of the Apple iPhone. If you are a loyal customer of theirs, the product lasts about 3 years (give or take). If they stay a customer, that means they will buy a new product from you every 3 years on average. That would then also be built into your model. This leads to the discussion of retention rates and churn, which become very important as your model becomes more sophisticated, but you don’t need to worry about this now at the beginning but know it is coming.
What if I have a different type or type of business model to generate revenue? (e.g., one-time charge, recurring revenue, transaction revenue)
What you do need to know at the beginning is the various types of revenue. This model assumes only simple “one-time charge” revenue. That is very nice in that it makes the model easy. It is also well accepted by customers and the most common form of revenue. This however does not mean it is the only and certainly not necessarily the best for you and your customer. In fact, the “one and done” model has some problems but it will never go away.
The “recurring revenue” business model or subscription model has become very popular driven by the boom of SaaS (Software as a Service) and its successful evolution. It is here to stay and investors, customers, and vendors generally love it. It has even spread to other non-software industries. It produces a steady stream of revenue for your venture that is predictable and robust against recessions and other economic fluctuations. Investors value this type of revenue much more highly than one-time revenue and customer may like the fact that they don’t have to pay upfront and they can depend on continual updates to their products. They may pay more in the end, potentially meaning a higher LTV, but they often are willing to do so.
Another major business model is the transaction business model where the customer pays based on their usage. Think of an electric utility and how it charges us. The consumables business model is also really a variation of this. You buy the razor but the more you use it, the more blades you use. Likewise for your printer. The more you use it, the more ink you buy. Again, for a certain customer base, this is very attractive and generally accepted as the norm of business.
This has not been incorporated into our simple model but it could be as below as another section like the “One Time” and “Recurring Revenue” sections.
Notice that you can combine business models, and businesses often do. The customer, in this case, is paying upfront for the product but they also pay a maintenance fee, which generates recurring revenue. In this case, the recurring revenue is proportionally small compared to the one-time revenue ($64K vs. $937K) but it can be much larger for other businesses. As stated previously, the recurring revenue has many very attractive characteristics and is highly valued by entrepreneurs and investors so don’t overlook this source. You should also look to think of creative ways to increase this stream of revenue.
It is definitely simpler if it is only one type of business model and if you had your choice, you would likely pick the subscription model. It would make the modeling much easier. That said, the subscription model is not without its weaknesses and each business model has its strengths and weaknesses. You have to find the best mix for your situation.
Also note that there are other business models that would make your financial revenue model more complicated like advertising, affiliate marketing (e.g., getting commissions), selling access to data, franchising, and more (see step 15 of the Disciplined Entrepreneurship 24 steps for a lot more details). All of these could be modeled and the principles are the same but it just gets more complicated.
The author
Bill Aulet
A longtime successful entrepreneur, Bill is the Managing Director of the Martin Trust Center for MIT Entrepreneurship and Professor of the Practice at the MIT Sloan School of Management. He is changing the way entrepreneurship is understood, taught, and practiced around the world.

The books
This methodology with 24 steps and 15 tactics was created at MIT to help you translate your technology or idea into innovative new products. The books were designed for first-time and repeat entrepreneurs so that they can build great ventures.

Hi Bill – it might be useful to mention at the very start that it is a “one time charge” model ( this is only mentioned in the latter part under “what if I have different types” etc ) . Maybe just to explain PMR also. I think its always good for start ups to play around with the model first just to get them use to the model /excel/the formula first. I have found that some founders are not familiar with excel at all and I find they need to get over the “excel shock” first, before contemplating their start up numbers.. I always tell them not to fear – letting them know that its ok to take numerous attempts at the start, that even if they dont have a definitive number at the moment, just to enter something to start experiencing with the model ( but never to delete the formula ! : )
Hi Bill – great chapter and very happy to read you again!
If it can helps, I would like to see the use of “standard” terms. Since Units is Customer/User I was expecting to see the common “average revenue per user” (ARPU)? What do you think? Just my 2 cents. Waiting for the book 🙂